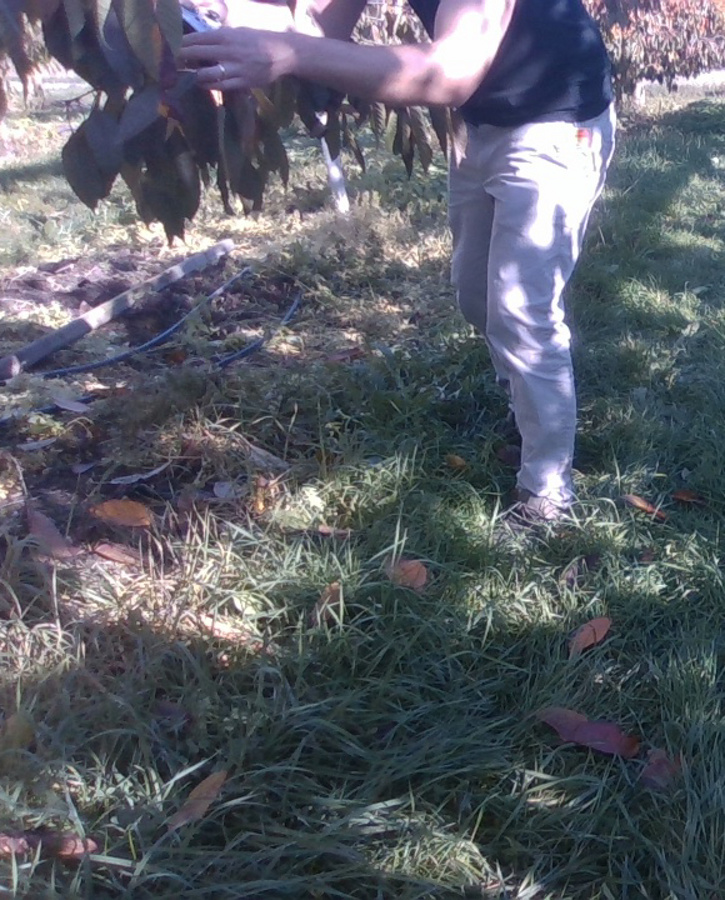
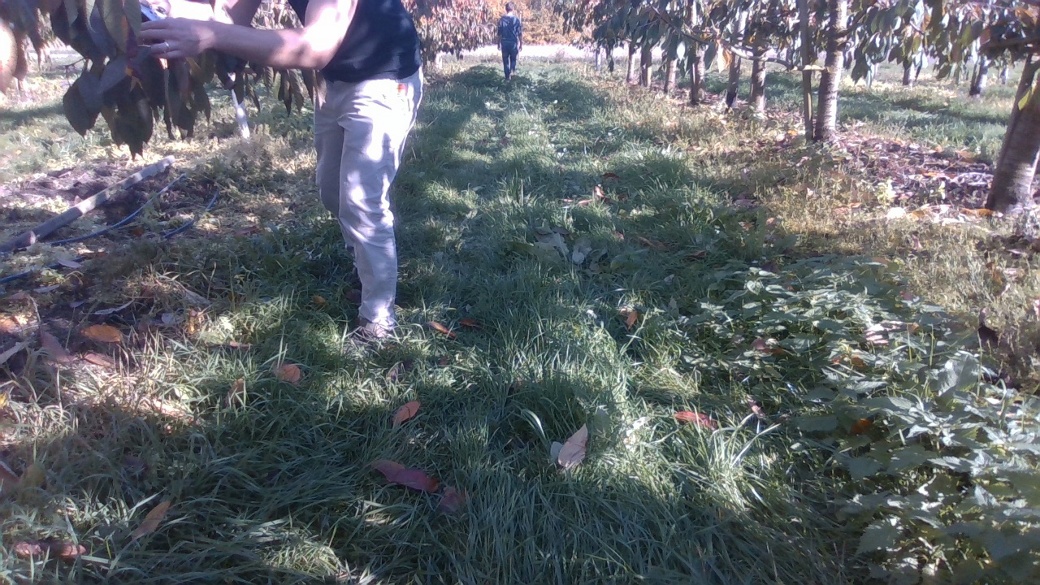
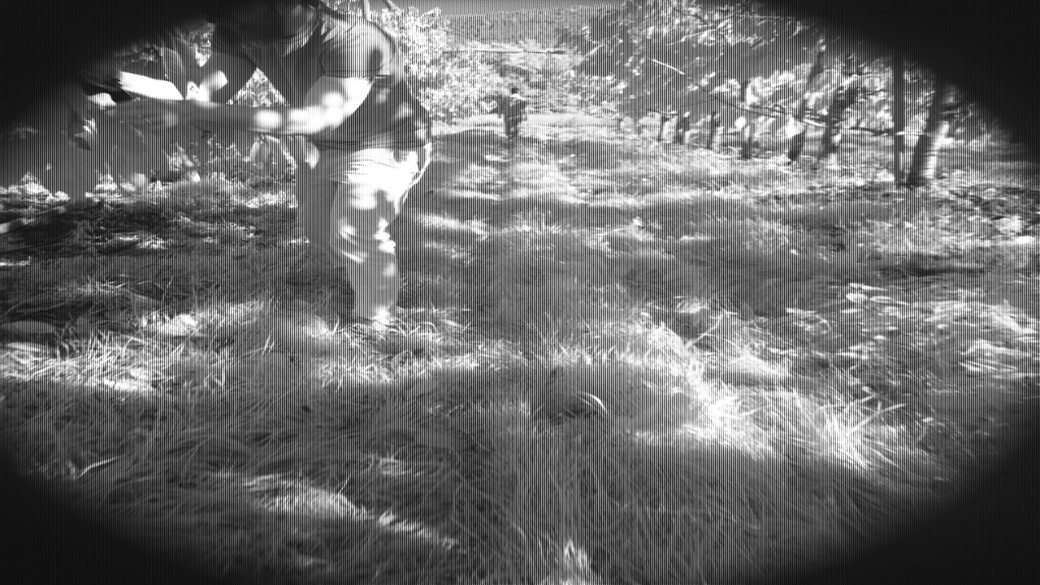
The data collected encompasses various scenarios, including the recognition of dirt roads and streets, both parallel and transverse to the direction of travel, as well as the detection of animals and people. The data structure is meticulously organized, with the 'Field' representing the uppermost storage unit, aligned with farming areas. Within each field, there are subdivisions known as 'Lines,' which are reflected in the folder hierarchy. Additionally, scenarios are described through metadata, detailing specific objectives such as road recognition or plant localization. The raw data sources are captured using Husky A200 robotics systems, which provide sensor readings, images, and associated metadata. This comprehensive data collection and organization enable precise analysis and application in various agricultural and environmental contexts, ensuring that the information is both accessible and actionable for further research and development.
What is covered by our comprehensive agricultural dataset?
Data Structure
The raw data from Husky is organized in a hierarchical structure, reflecting the physical measurements of agricultural fields.
Hierarchical Levels
- Field (Level 1): The root folder represents a specific agricultural field.
- Line (Level 2): Subfolders divide each field into lines.
- Sequence (Level 3): Further subdivisions of lines into 5-meter segments.
- Measuring Points: Recorded every 30 cm, containing all sensor data at a specific point in time.
Data Types and Storage
- Images:
- Captured from RGB, multispectral, and thermal cameras.
- Stored in sequence-specific subfolders (e.g., 20231115_0000000_00_2/realsense_front).
- Radar Data:
- Includes 2D and 3D radar measurements.
- Stored as Protobuf-encoded messages (one file per sensor, per sequence).
- Metadata:
- Per Line: context.json (e.g., weather, humidity, duration).
- Per Sequence: telemetry.json (e.g., GPS data).
This structure ensures logical organization and efficient access to field, line, and sequence-specific datasets.

Raw Data
The figure below illustrates the current storage structure. This structure directly reflects the "real" measurement of agriculture fields:
- Data is recorded for a Field (folder level 1)
- a Field is divided into "Lines" (folder level 2)
- each Line is further divided into "Sequences" (folder level 3) - each of 5m length
- a Sequence holds the "real" Measuring Points
A Measuring Point is collected every 30 cm. A Measuring Point refers to the recordings of all sensors at a specific point of time.
The following data is recorded:
- images of four different types of cameras (RGB, multispec, thermal, depth): the images are stored in the corresponding subfolders per sequence (e.g. 20231115_0000000_00_2/realsense_front)
- radar data of two different types (2D, 3D): all radar related measuring points of a sequence are stored as Protobuf encoded messages in one file (one file for each sensor)
Metadata: Currently, the collected metadata holds the following information (details see below):
- per Line: context.json (weather, humidity, duration, etc.)
- per Sequence: telemetry.json (GPS only)

Radar Files and Naming
For the two modes for Radar 1 to 4 add the string "short" and "long" to differentiate both modes.

Folder Structure

Metadata
telemetry.json:
The telemetry.json file meticulously captures essential data such as GPS RTK coordinates, speed, and acceleration, ensuring precise and comprehensive tracking of movement.
Example:
{
"vehicle": "Husky",
"measurement_points": [
{
"timestamp": 1699873492894,
"gps": {
"latitude": 8.9516,
"longitude": 49.975345
}
},
...
}
context.json
The context.json file holds weather- and field-related metadata. "sources" provides information about the related weather station. For all points of a line, all these metadata are the same.
Example:
{
"weather": {
"timestamp": "2024-03-06T09:00:00+00:00",
"cloud_cover": 100,
"condition": "fog",
"dew_point": 4.13,
"solar_60": 0.132,
"precipitation_60": 0.0,
"pressure_msl": 1022.9,
"relative_humidity": 100,
"visibility": 149,
"wind_direction_60": 63,
"wind_speed_60": 3.6,
"sunshine_60": 0.0,
"temperature": 4.2
},
"sources": {
"dwd_station_id": "03413",
"id": 47580,
"observation_type": "synop",
"lat": 50.4522,
"lon": 8.7317,
"height": 155.0,
"station_name": "Muenzenberg-Gambach",
"wmo_station_id": "L631",
"first_record": "2024-03-05T02:30:00+00:00",
"last_record": "2024-03-06T09:00:00+00:00",
"distance": 15415.0
},
"additional_data": {
"field_description": "",
"field_catagory":"",
"acquisition_method": "",
"duration": ""
"scenario": ""
}
}
Sensors
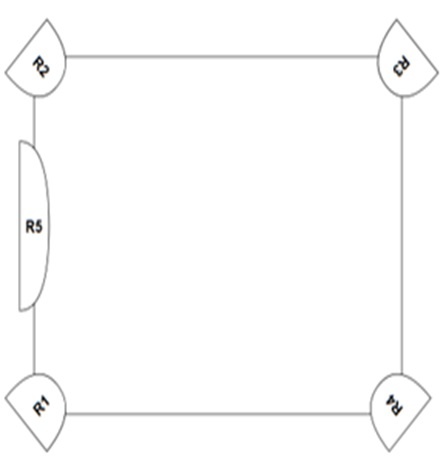
The cameras are oriented in the driving direction and tilted 20° downward, ensuring a comprehensive view of the field ahead. Complementing this setup, SRR520 radars are strategically positioned at the corners, oriented horizontally to the plane in 45° steps, providing robust coverage and detection capabilities. Additionally, an extra frame is incorporated to enhance the structural integrity of the system, ensuring durability and reliability in various driving conditions.

- The multispectral camera is the MSC2-AGRI-1-A by Spectral Devices: https://spectraldevices.com/products/agriculture-camera
- The underlying camera model is a MBCM401U3V by Omron Sentech with 2048x2048 px resolution
- 4 spectral bands are achieved by a special filter array, resulting in 512x512 px for each band, as depicted below
Deriving the individual spectral bands of a recorded image.

- The ros2_tum framework saves images of the multispectral camera in a 2048x2048 px 8-bit mono format ("raw")
- This image is a mosaic of the 4 spectral bands as depicted above
- To derive images of each band, a demosaicing as per the given pattern must be performed
- A single band can be derived by stitching pixel with a stride of 2 in both dimensions (or simply 4 with Python slicing)
- e.g.: image_580 = image_mono[::4].reshape(1024, 1024, 1)
Radar – Notation and Coordinate System

Ri -> Vertical Distance [m]
VRi -> Radial Relative Velocity [m/s]
ϕi1,ϕi2,ϕi3 -> Azimuth Angle w.r.t various axes [rad]
In addition to the positional measurements the RDI provides radar specific attributes such as the radar cross section (RCS), a false detection indicator (called pdh0) and the signal to noise ratio (SNR). The availability of these features depends on the radar sensor type.
Number of Detections per Sensor

Do you want to know more?
*If the contact form does not load, please check the advanced cookie settings and activate the functional cookies for the purpose of contact management.